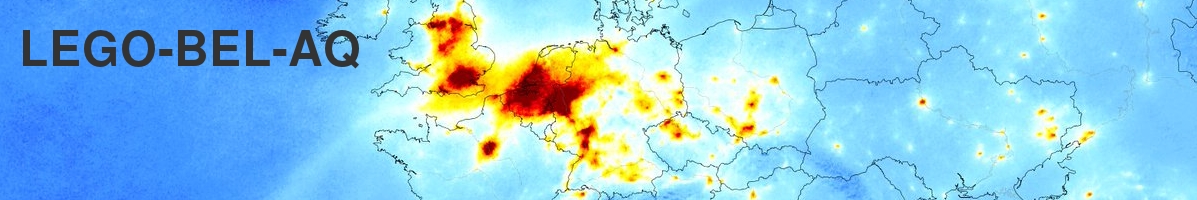

Low-Earth and Geostationary Observations of BELgian Air Quality (LEGO-BEL-AQ) is a project funded by BELSPO under the BRAIN-be 2.0 programme. Its objective is to exploit the full spatio-temporal resolving power of the LEO and GEO Copernicus Atmospheric Sentinel missions to support air quality policies in Belgium.
This includes the production of high spatial resolution maps of NO2 based on S5p-TROPOMI data over Belgium, and R&D on the complementarity and synergies within the (future) LEO+GEO constellation.
City-specific results can be found here.
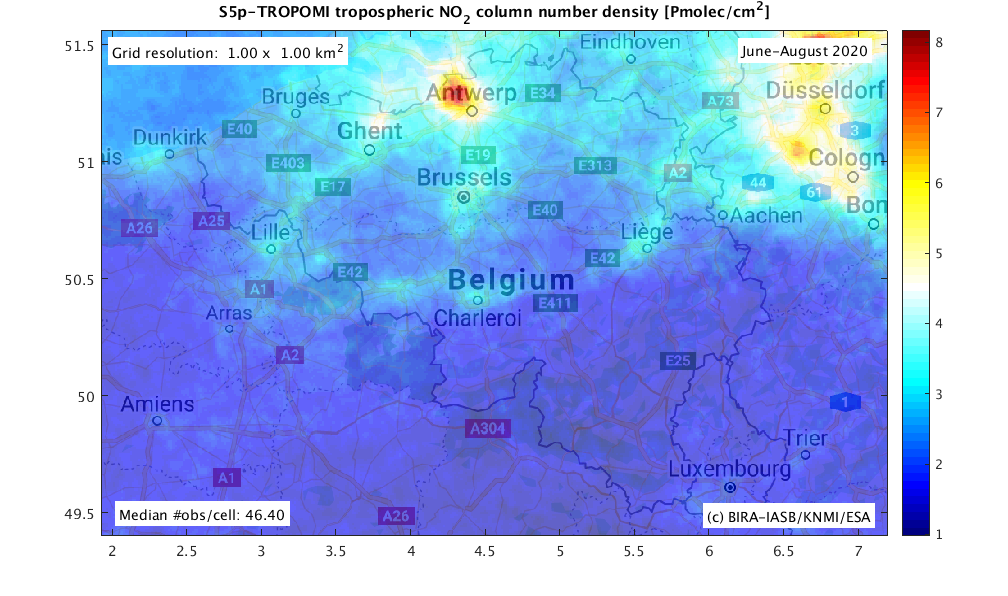
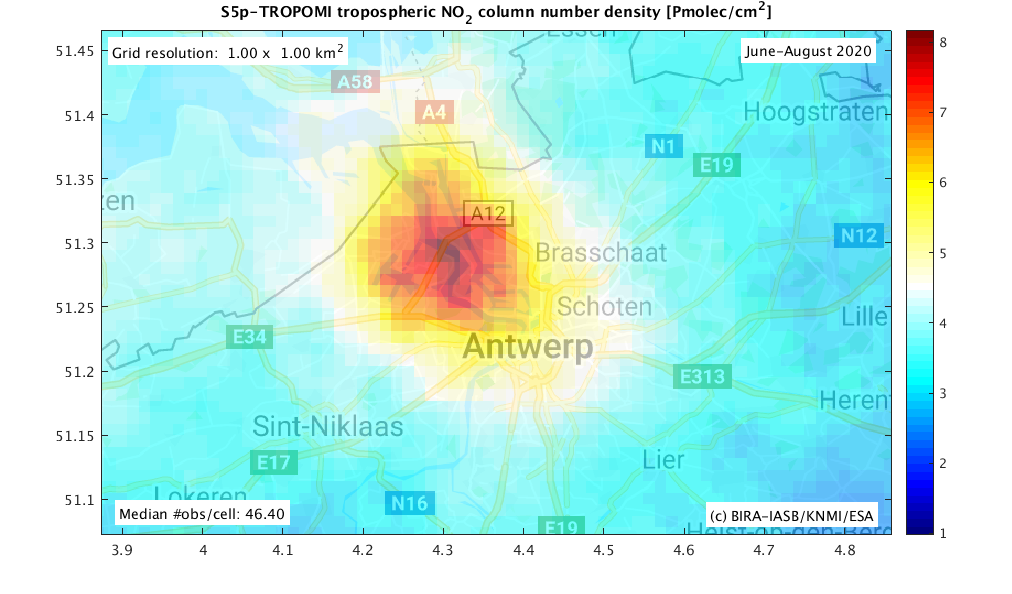
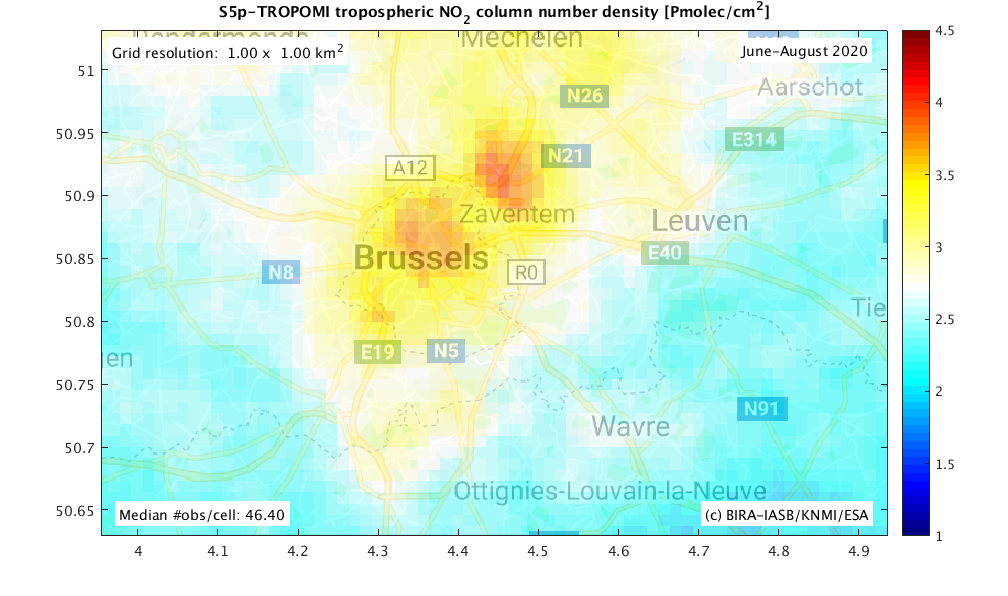
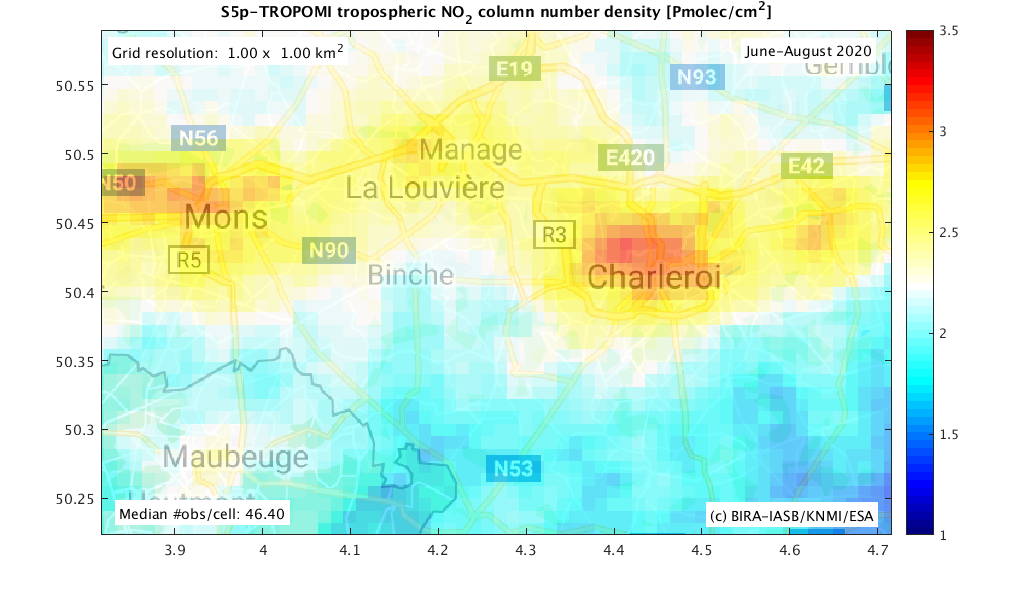
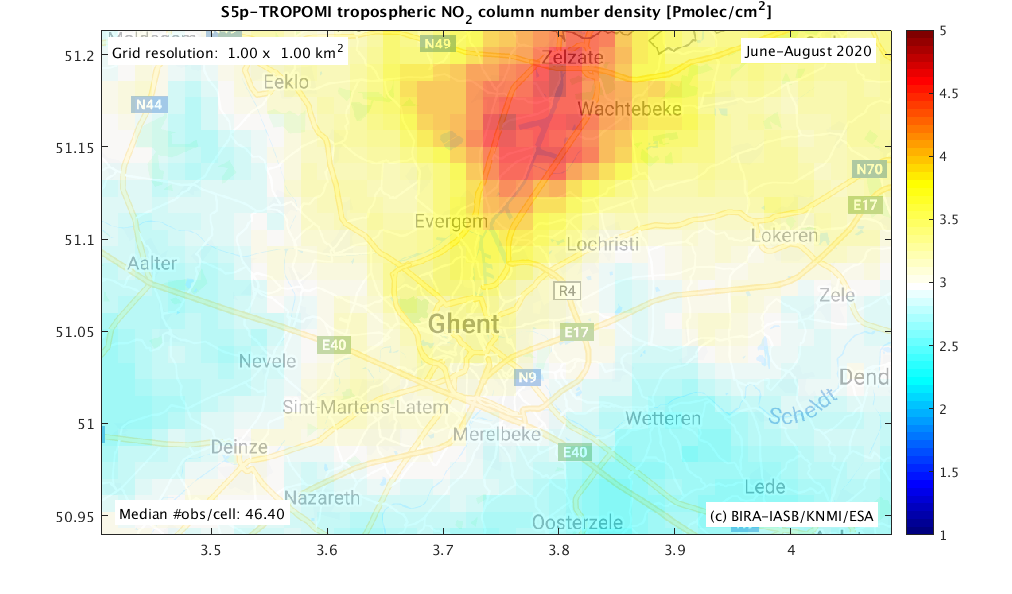
S5P-TROPOMI tropospheric NO2 column number density [Pmolec/cm2]
Grid resolution: 1.0 x 1.0 km2 Date: June-July-August 2021
The interactive map below presents long-term average tropospheric NO2 column values per Belgian municipality. These results are based on the LEGO-BEL-AQ oversampled (1km by 1km) S5P-TROPOMI data (PAL reprocessing + OFFL processing).
The high-resolution maps produced hitherto are available in two formats:
- As netCDF (network Common Data Form) data files (.nc extension) for a single region covering Belgium and parts of its neighbouring countries, and for a single temporal averaging window size (91 days).
- As PNG (portable network graphics) graphics files (.png extension) for selected regions of interest, including a street map background and some essential annotations (i.e. the format of the graphics shown in the previous section).
The first version of the catalogue is available through anonymous ftp at
ftp://ftp-ae.oma.be/pub/from_Tijl.Verhoelst/LEGO-BEL-AQ/Maps/
The netCDF files
The region covered by the netCDF files is essentially that of the overpass files on which the gridding is performed (see Sect. 2 and Figure 1). The only temporal averaging windows offered to the public at this moment is 3 months (91 days), which we consider the optimum to allow the assessment of seasonal and long-term changes at increased spatial resolution.
Files are named according to the following scheme:
S5p_L3_<area>_<startdate>_<enddate>_<uv>maxWind_<resolution>km.nc
where <area> is for instance “legobox” for the entire processed area, <startdate> and <enddate> are formatted yyyymmdd, <uv> is the maximum wind speed filter in m s-1 (999 if not applied), and <resolution> the grid cell size. The netCDF file used to produce the example maps on the website is named:
S5p_L3_legobox_20200601_20200830_999maxWind_1.0km.nc
Note that the end date is not 31 August as we chose to have a fixed temporal aggregation window of 91 days for the 3-monthly averages.
The netCDF files currently contain the following variables:
- double tropospheric_NO2_column_number_density {time = 1, latitude = 555, longitude = 1049} [Pmolec cm-2]
- double cloud_fraction {time = 1, latitude = 555, longitude = 1049} [] (weighted average per grid cell, as for the tropospheric_NO2_column_number_density)
- double datetime {time = 1} [days since 2000-01-01] (weighted average per grid cell, as for the tropospheric_NO2_column_number_density, akin to an “effective” time)
- int32 count {time = 1} (total number of independent measurements contributing to the complete map)
- float weight {time = 1, latitude = 555, longitude = 1049} (total weight of the contributing L2 measurements, per grid cell)
- double latitude_bounds {latitude = 555, 2} [degree_north]
- double longitude_bounds {longitude = 1049, 2} [degree_east]
The PNG files
Graphics files in PNG format are produced from the netCDF files described above for the following fields-of-view (FOV): the entire overpass box (legobox), Belgium, Antwerp, Brussels, Ghent, Liege, and Mons. As the best colour scale depends heavily on the concentrations but some homogeneity is still desirable to aid intercomparisons, the maps are produced for 3 fixed colour scales: “low” (1-3.5 Pmolec/cm2), “medium” (1-5 Pmolec/cm2), and “high” (1-8 Pmolec/cm2). They are organized in the following folder structure:
/<tempAvgWindow>/<colourScale>/<FOV>/
Color scales are dynamic and may vary from map to map.
©Contains modified Copernicus data processed @ BIRA-IASB
Color scales are dynamic and may vary from map to map.
©Contains modified Copernicus data processed @ BIRA-IASB
Color scales are dynamic and may vary from map to map.
©Contains modified Copernicus data processed @ BIRA-IASB
Color scales are dynamic and may vary from map to map.
©Contains modified Copernicus data processed @ BIRA-IASB
Color scales are dynamic and may vary from map to map.
©Contains modified Copernicus data processed @ BIRA-IASB
Color scales are dynamic and may vary from map to map. 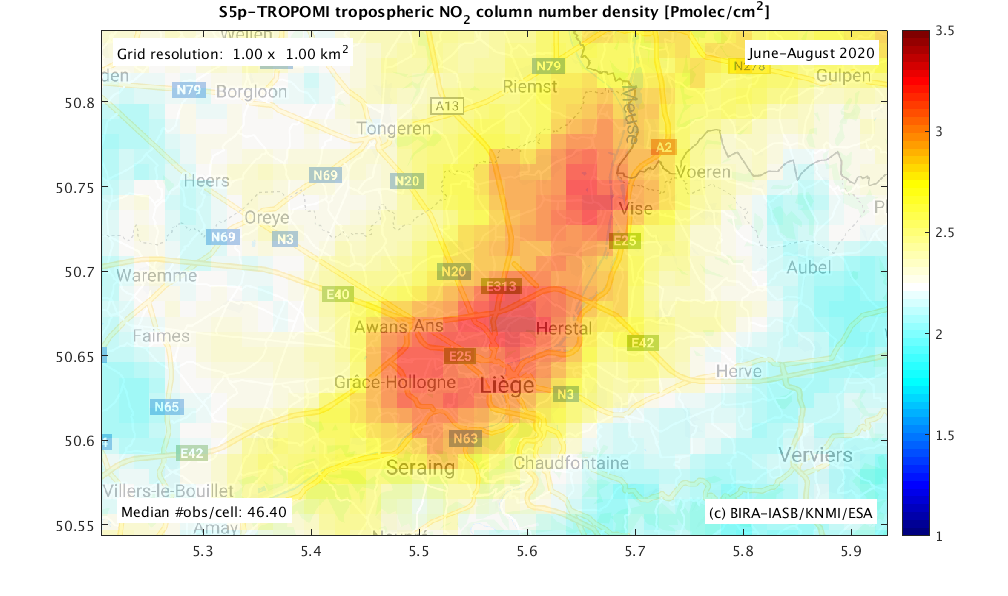
©Contains modified Copernicus data processed @ BIRA-IASB
Page 1 of 2
- You are here:
-
Home

- Uncategorised